Posted in Content, Points of Interest, Presentation Planning
Jumpstart your visual thinking here
Nobody argues that we need to transcend bullet points. And nobody argues that it’s easier said than done.
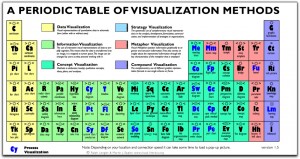
Here’s a great tool to help you do just that… The Periodic Table of Visualization Elements…replete with mouse-over previews of each idea.


Todd J. List
This is an interesting concept. This is a great resource to help someone find new and creative ways to communicate information. From that perspective, I would use it.
However, I take issue with many of the pop-up “examples.” Many are cluttered and visually distracting, with too much emphasis on decoration and showcasing graphic design skills and too little on conveying information. See the work of Edward Tufte, especially The Visual Display of Quantitative Information (http://www.edwardtufte.com/tufte/books_vdqi).
This table is a good resource (I bookmarked it), but I caution against expending too much time, and energy creating fancy graphics when simple ones can be as, or more, effective. This holds for live presentations as well as virtual ones.
Thanks for the recommendation.
TheVP
Todd, thanks for dropping by. I think you’re right – it’s not perfect (nothing is).
What I do like about it is making an attempt at a taxonomy for approaching a subject where 1) there’s precious little quality information and 2) not everyone agrees on how to approach it. So I thought I’d share the resource.
I do like Tufte. And if you like chewy content like his, you might also check out Stephen Kosslyn’s Clear and to the Point: 8 Psychological Principles for Compelling Powerpoint Presentations (which has two solid chapters on presenting quantitative and qualitative information) and Andrew Abela’s blog and Advanced Presentations by Design which delivers nuggets like this favorite of mine: http://www.extremepresentation.typepad.com/blog/2006/09/choosing_a_good.html.
Thanks for sharing
Phil Zulli
Wow! A great piece of work. Kudos to the creator.
I’ve never see a more complete comparison of visual thinking tools. And the periodic chart metaphor is elementally inspired.
Thanks!
Laura Harvell
How can I actually get one of these visual thinking tools?
TheVP
Laura, here’s where you can get the pdf (http://www.visual-literacy.org/pages/documents.htm), though it’s not interactive like the web page. Check out the rest of http://www.visual-literacy.org for other books and resources. -R